Ask for the report you need
Describe a board pack, operating review, or people update in plain language. Give the period and audience; the report draws on company data the product supports.
Ask for a board pack, operating review, or people update in plain language. Zipplee builds an editable report with figures tied to the supported company data behind them. Return next month, update the numbers, inspect what changed, and review the story before sharing.
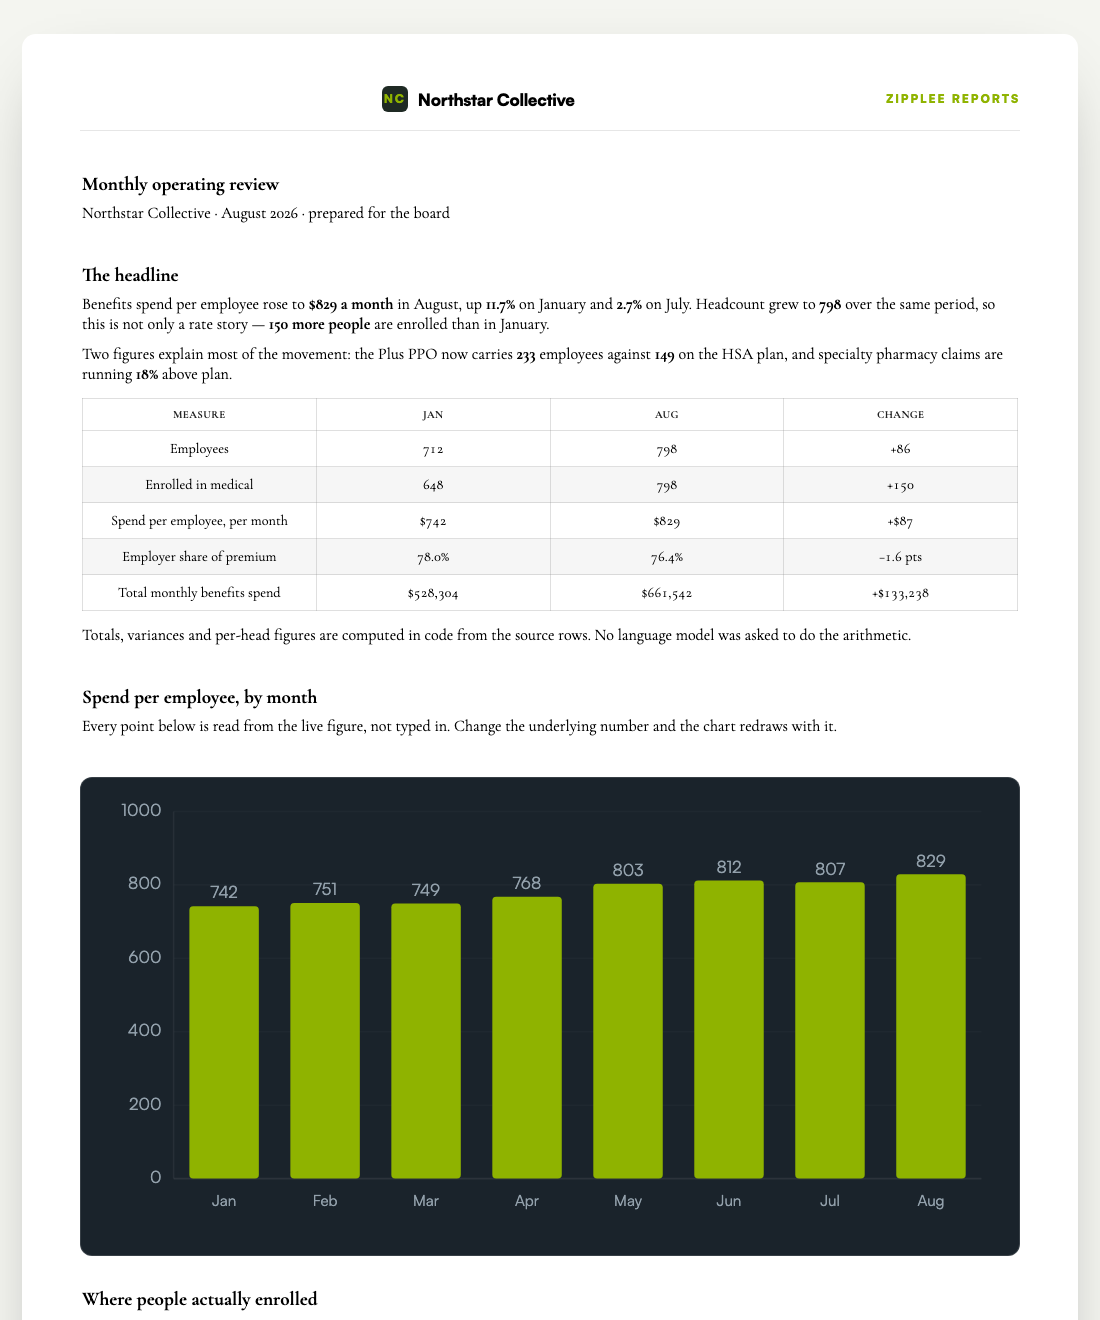
Explore a selection of generated report and document templates: finance reviews, portfolio decisions, pipeline and vendor updates, and workforce analysis. Each preview uses illustrative data. Open a page to inspect the design at full size.
These sample covers come from Zipplee’s Document Studio template library. Choose a template in the HR console to open editable pages; supported linked figures can fill from your company records. The organisations and figures shown here are fictional.
Describe a board pack, operating review, or people update in plain language. Give the period and audience; the report draws on company data the product supports.
Linked figures keep the saved question behind each value, including numbers in tables. A figure without a data link stays editable, but cannot be refreshed from your records.
“Update the numbers” re-asks the saved questions behind linked figures and marks what changed. Supported single-series charts tied to those questions replot; the written interpretation remains yours to review.
A linked single-breakdown chart can use “Get the real numbers” to re-ask just its own question, without refreshing the rest of the report.
Click a linked figure to see its earlier values where historical records are available. Double-click when you need to edit the figure itself.
If a refresh would turn every existing nonzero figure on the page into zero, the editor refuses that update. Missing records and failed questions do not silently replace a value with zero.
Work with the report’s prose, tables, charts, and page design. Correct the explanation and decide what the audience should see before it leaves the editor.
Share the reviewed report or export it as a PDF, web page, or Excel workbook of its charts and tables. The Data view puts charts and headline figures in one place.
See how a recurring operating review moves from a question to a report ready for review.
Ask for a monthly operating review from the company records Zipplee supports. Name the audience, period, and decisions the report should help with.
Inspect the linked figures and charts, edit the commentary, and arrange the designed pages for the audience.
Choose “Update the numbers” for linked figures, inspect what moved and what held steady, then revise the explanation. Share or export only after review.
An editable document that combines prose, tables, and charts with supported live data bindings. Review the interpretation, then share the report, save it as a PDF, download a web page, or take its charts and tables into an Excel workbook. Live Reports is included with Studio or available on its own.