Overview
See practice runs and pass rate, team coverage, average score, people certified, pathways, and live survey and poll counts. Open the relevant tab for the full breakdown.
Analytics brings the results of published content, learning, practice, certifications, surveys, polls, and wellness into one HR workspace. Start with the company overview, open a focused view, and use the recorded activity to decide what deserves a closer look.
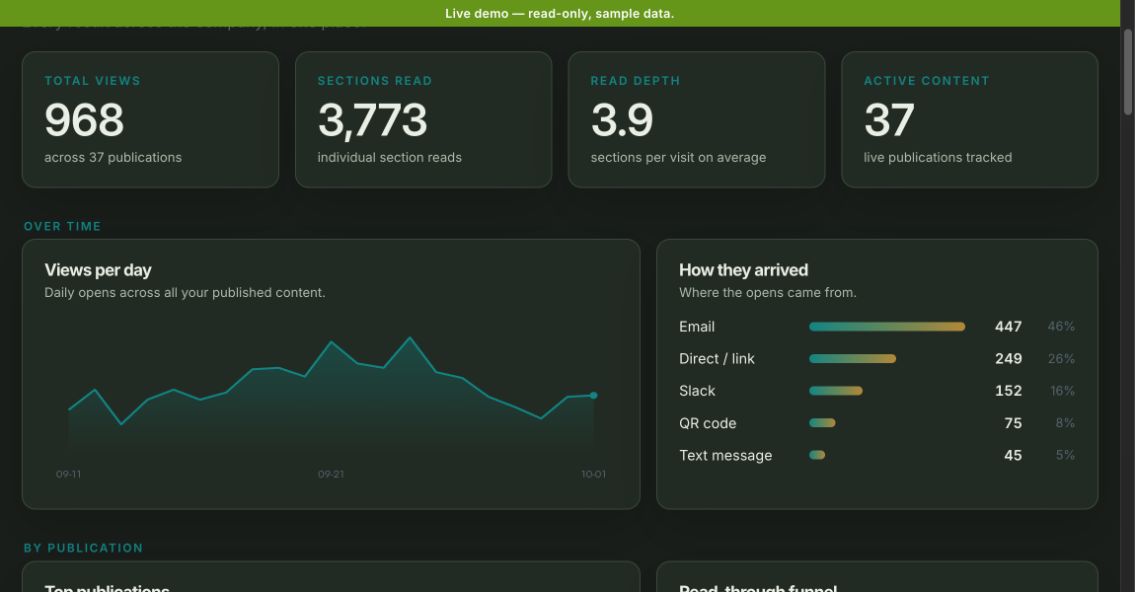
Publication opens are only a start. The Engagement view also shows section reads, average read depth, daily activity, where visits came from, top publications, and how far readers reached in a selected guide.
The Overview highlights company-wide signals. Each tab then answers a more specific question, using the records available to your organisation.
See practice runs and pass rate, team coverage, average score, people certified, pathways, and live survey and poll counts. Open the relevant tab for the full breakdown.
Switch between the last 7 and 21 days. Compare publication views, section reads, read depth, arrival sources, languages, recent activity, and each guide’s read-through funnel.
Select a published course to see learners, average mastery, topics, and at-risk topics. Review proficiency by topic to find where teaching or review may help.
Examine runs, average score, pass rate, and coverage. Break results down by team, skill, scenario, and person to plan another practice round.
See who is certified, what has expired, and who has not started. Compare pathways alongside their course and practice requirements.
Review each survey’s status, question count, intended audience, responses, and response rate. Open its results when the numbers call for a closer reading.
Track live polls and responses against each poll’s eligible audience, then open the answers in Surveys & Polls.
See company-wide mood, check-in participation, healthy habits, and the daily trend. Individual check-ins and journal writing are not shown here.
Choose a publication to see its views by day, sections reached, average depth, languages, arrival sources, and recent activity. A view is an open, not a count of unique employees; read depth averages recorded section reads per open.
Learning mastery, practice performance, and certification status appear in separate views. Together they help a team spot weak topics, difficult scenarios, and credentials that need attention without collapsing them into an invented single score.
Survey and poll response rates use the intended audience as their denominator. Wellness Pulse reports only company-wide totals; an employee’s journal text and individual mood are not exposed in the Analytics view.
Analytics reports recorded activity and outcomes. It cannot, by itself, explain why someone did or did not engage.
A practical way to use the results after publishing an employee guide.
In Engagement, compare the last 7 and 21 days to see whether opens rose after the guide was shared and which channels brought readers in.
Open that publication and look at its section read-through. Review survey or poll responses separately for questions people still have.
Clarify the section people missed, send a targeted follow-up, and return to the same views to see whether recorded behavior changed.
A clearer picture of what people opened, read, completed, practiced, answered, and earned—plus aggregate wellness participation. Use the relevant view to make the next communication, learning assignment, or review more specific.